That game went to 3 overtimes. They allowed 76 in regulation. Counting the points they gave up in 15 extra minutes of play increases their average by more than 7 pts per game. How is it cherry picking to not count those points? I mean, there is a reason reputable analytic sites calculate stats on a per possession basis.
The purpose of the discussion is to see whether we have been playing consistently good defense in league play. Comparing us to our peers in the same category seems like a directly relevant comparison. Points per minute or, even better, per possession is the best gauge.
Then let's do that properly, shall we?

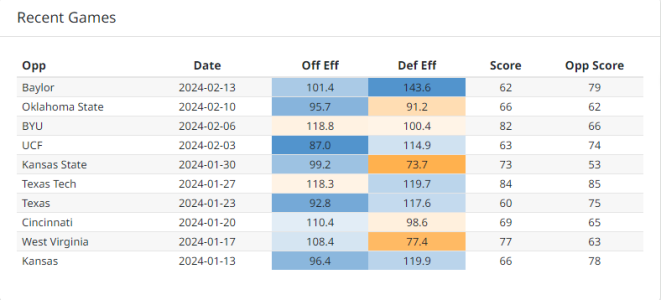
Oklahoma's last 10 games:

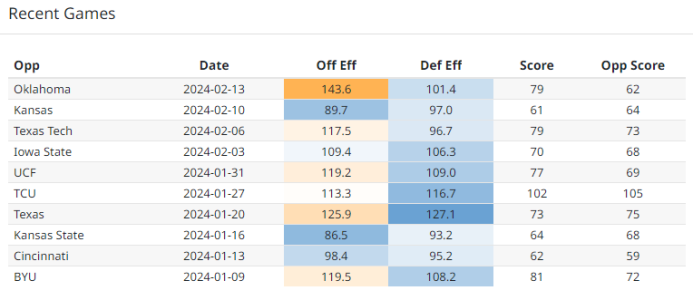
Baylor's last 10 games:

You have to look beyond the score. It goes into shooting %, rebound %, everything. So more holistically, let's break it down.
Again, I am going to include the outliers for both, so it will skew that data slightly.
OU - Offense (102.84), Defense (105.7), (5-5)
BU - Offense (112.3), Defense (105.08), (6-4)
Lower number is better for defense, higher for offense.
Those are the overall view over the last 10 games via efficiencies. If we omit the last game they played against eachother, it looks like this:
OU - Offense (103.00), Defense (101.48), (5-5)
BU - Offense (108.82), Defense (105.48), (6-4)
OU, has been a much better team in conference play. Our offense has been our downfall. I can look at losses alone if you like.
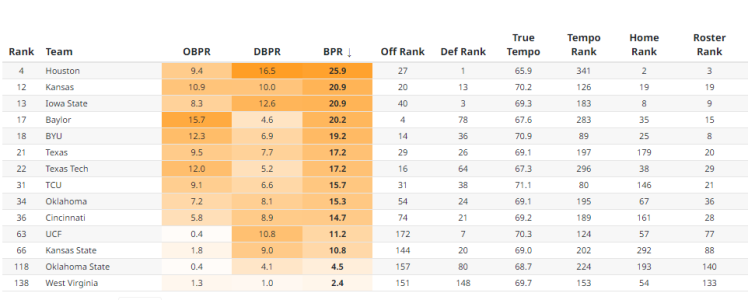
Evan Miya for Data Ref
Edit to add: If you want to use reputable sources that use PPP...then do that, don't just omit games just bc.


